Field Constraints That Kill Robot Deployments: Terrain, Weather, Crop Spacing
The site conditions that grounded your robot were visible before deployment. Here's how to read them.
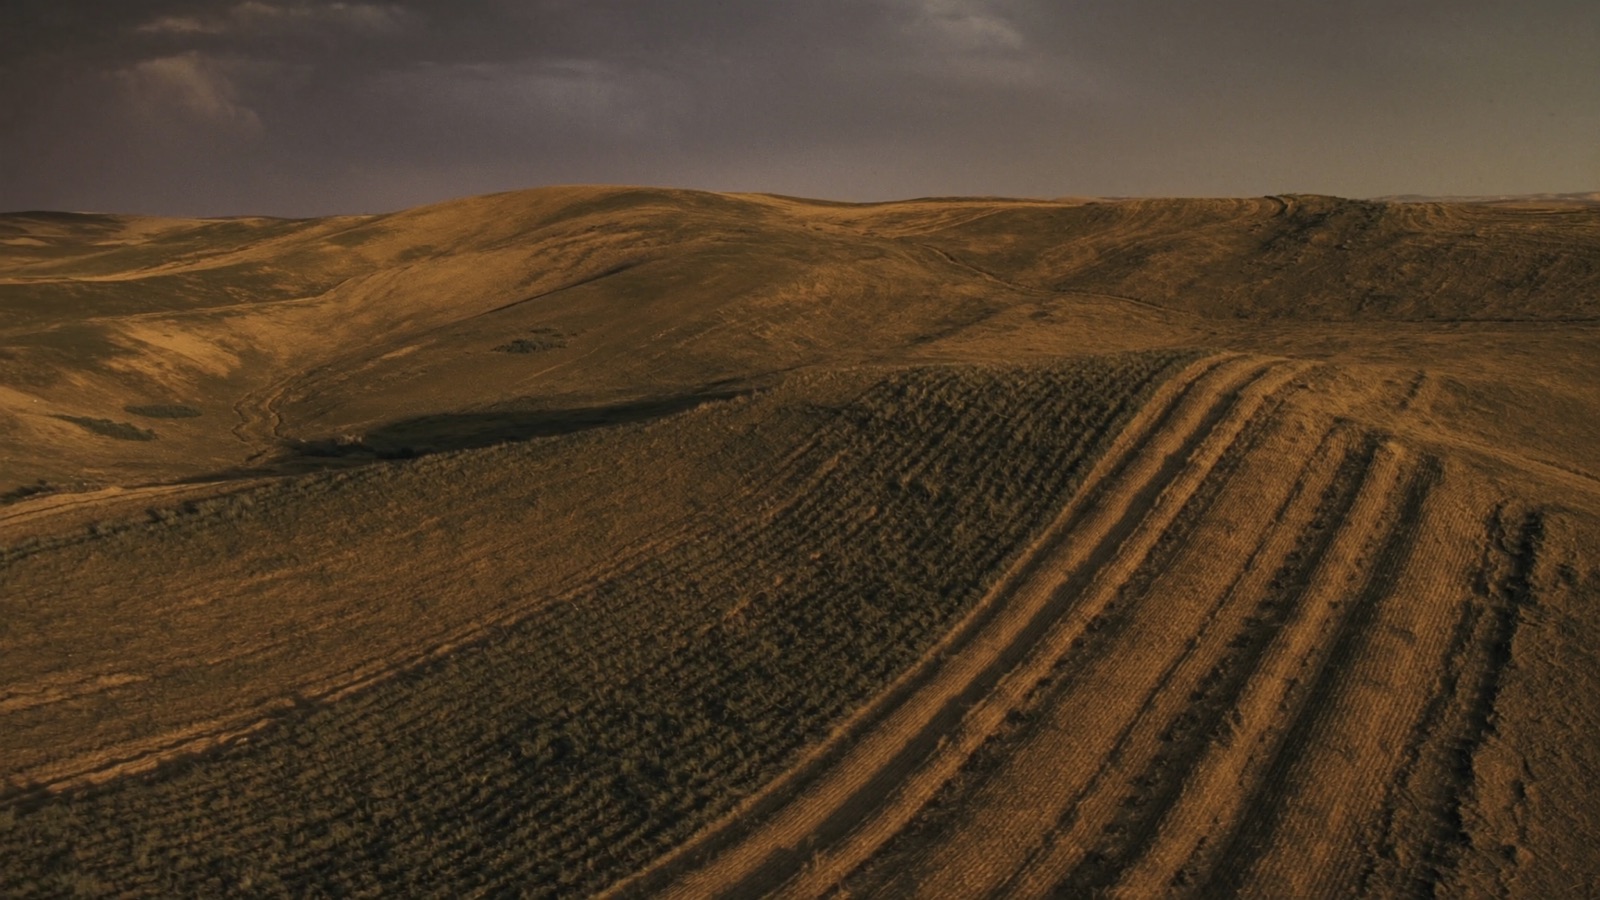
In 2023, a specialty crop operation piloting an autonomous weeding robot in the Pacific Northwest discovered the problem about 60 days into a 90-day pilot: the machine could not reliably operate on the slopes at the far end of the property. The vendor's spec sheet listed a 15-degree maximum operating slope. The fields that needed weeding most urgently — where the hand crew had historically skipped due to difficult terrain — averaged 17 degrees. The accessible fields had already been partially remediated through manual methods. The robot spent most of its operating time on fields that needed it least.
This is not a technology failure. It is a site-assessment failure. The slope data existed. Nobody looked at it before signing the pilot agreement.
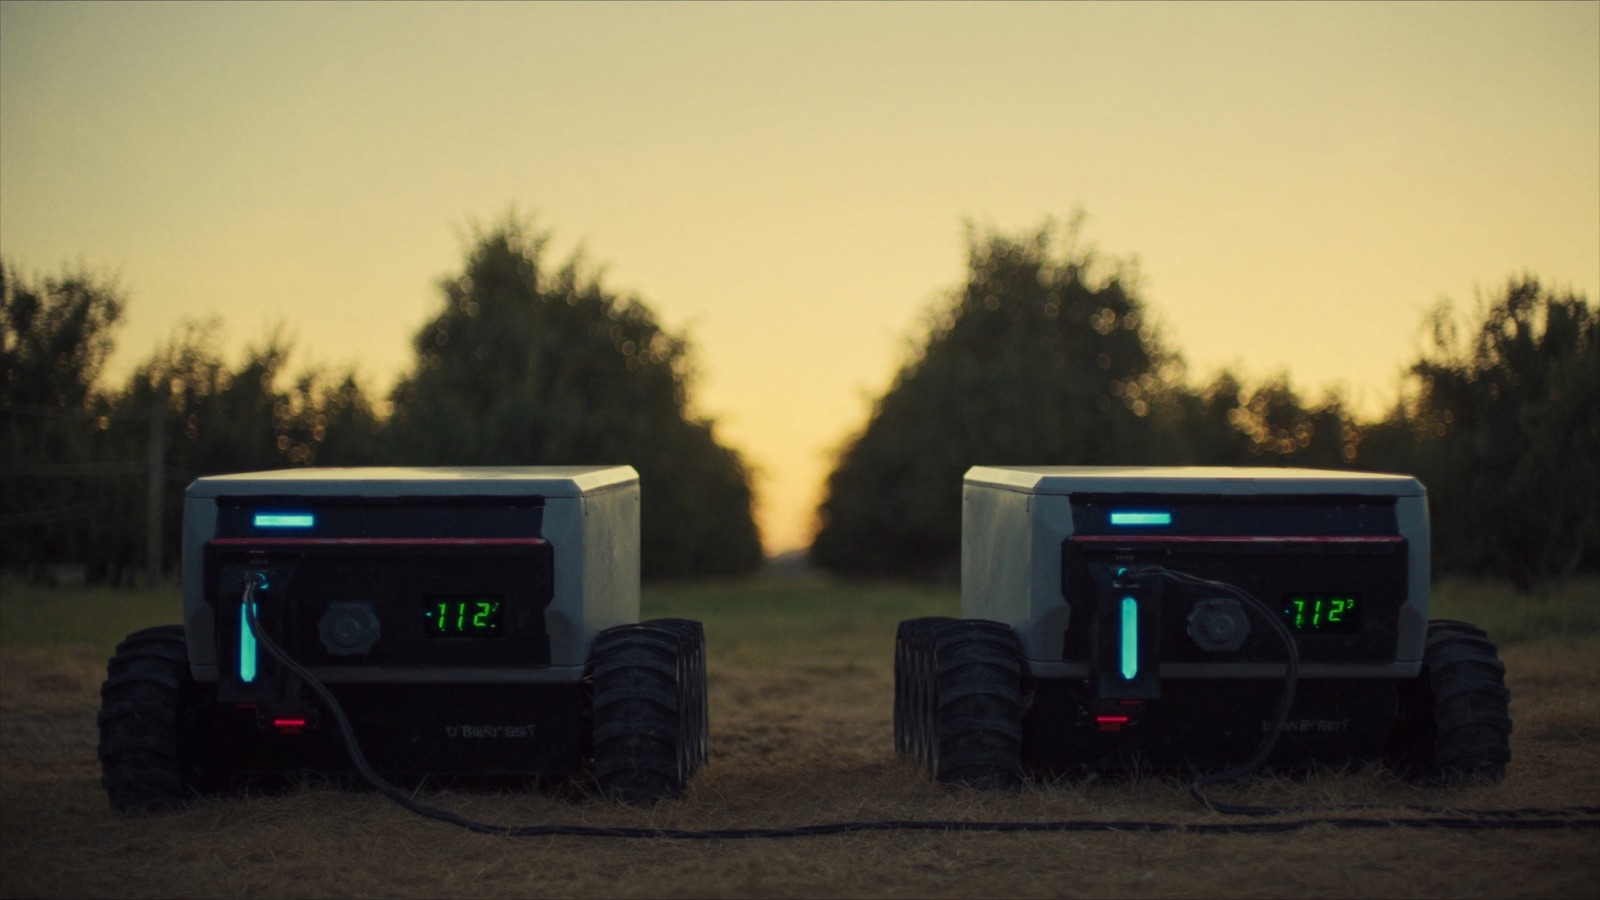
Ag robot deployments fail for technical reasons less often than they fail for environmental and geometric reasons. The four most common physical constraints — terrain, weather windows, crop spacing, and headland geometry — are all measurable before deployment. This article explains how to measure them, what thresholds to apply, and how to use the data in vendor negotiations.
Terrain: Slope, Compaction, and Surface Conditions
Slope Gradient
Most wheeled agricultural robots have rated maximum operating slopes. Common figures:
- Naïo Oz (vineyard/market garden): up to 30% (approximately 17 degrees)
- Burro (harvest assist, orchard): up to 40% (approximately 22 degrees) on some terrain configurations
- Carbon Robotics LaserWeeder: relatively flat-field optimized; performs best below 8 degrees
- FarmWise Titan FT-35: designed for California Salinas-type flat to gently rolling — not rated for steep slope
A slope exceedance of even 2–3 degrees above the machine's rated maximum creates multiple problems: tipping risk, drivetrain stress, sensor attitude errors (cameras and LiDAR on a tilted platform see differently than on flat ground), and implement height variation that degrades treatment precision.
How to measure:
- Drone survey with DEM (Digital Elevation Model) output: standard for precision ag operations, typically $200–$500 for a 100-acre farm using current fixed-wing drone services
- USDA Web Soil Survey includes slope data by soil mapping unit — good for initial screening before investing in drone survey
- SRTM (Shuttle Radar Topography Mission) global DEM, freely available at 1-arc-second resolution (~30m): useful for field-to-field comparison, not sufficient for precise within-field slope assessment
Generate a slope map. Identify any area where slope exceeds the machine's rated maximum. Quantify the affected acreage as a share of your total planned operating area. If it's above 20%, this constraint is material to the economics — the machine cannot access a meaningful portion of the target acreage.
Soil Compaction and Trafficability
Heavy agricultural robots — particularly autonomous tractors and large implement carriers — create compaction risk in wet soil conditions. The Monarch Tractor MK-V weighs approximately 9,000 lbs. FarmWise's Titan FT-35 is substantially heavier. Running these machines in soil below field capacity (too wet) causes compaction that persists through multiple seasons and can reduce yields in affected zones.
Trafficability windows — the days per year when soil moisture conditions permit vehicle traffic without compaction damage — vary dramatically by region and soil type:
- Sandy loam soils in California's Central Valley: trafficable 200+ days/year
- Clay-heavy soils in the Midwest Corn Belt: trafficable 60–90 days/year, concentrated after spring dry-down
- Pacific Northwest river-bottom ground: trafficable windows that close rapidly after any rain event
Know your trafficability window before calculating operating-days assumptions in your TCO model. A robot that assumes 120 operating days in a region where soil conditions permit only 80 is generating optimistic economics.
Soil sensors (capacitance probes, tensiometers) and trafficability prediction services (some precision ag platforms offer this) can help forecast windows. At minimum, log your historical field-access dates for the past 3–5 seasons as a baseline.
Rocks, Debris, and Surface Obstacles
Row-crop fields in rocky regions, recently cleared ground, or fields with irrigation infrastructure partially buried or at-grade present obstacle risks that vision systems may not reliably detect, especially at speed.
Autonomous navigation systems typically stop when they detect an obstacle above a certain size threshold. Sub-threshold obstacles — small rocks, partially buried rebar from old irrigation stakes, hardened soil clods — may not trigger the stop but can damage implements or disrupt the machine's navigation.
Walk the fields with the robot's lidar and camera specifications in mind. Identify: rock outcroppings, end-of-field debris berms, irrigation inlet boxes that protrude above grade, old fence posts, drainage tile inlets. Document their locations. Include this in the field map you hand the vendor before deployment, not after the first incident.
Weather: Operating Windows and Sensor Degradation
Fog and Low-Visibility Conditions
Coastal California, Pacific Northwest, and Great Lakes regions all have regular fog events that affect machine vision systems. Camera-based weed detection systems trained on clear-condition imagery can lose 20–40% of their classification accuracy in fog below 50m visibility. Some systems have no fog-operation mode at all.
The practical question: how many days per operating season does your farm experience visibility below 100m? In many coastal growing regions, the answer is 20–40 days — a significant share of the weeding window for cool-season crops. If the machine can't operate in fog, you need either a hand-crew fallback plan or a shift to later-season operation when fog clears earlier.
What to ask the vendor: "Show me your detection accuracy data in conditions below 50m visibility. Do you have field data or do you have lab data?" Lab data under simulated fog is not a substitute for field performance data.
Rain and Precipitation
Most autonomous ag robots are rated for light rain (drizzle). Moderate rain above ~5mm/hr degrades vision sensors, increases slip risk on wheeled systems, and can force soil conditions below trafficable threshold on sensitive soils.
In humid agricultural regions (Southeast U.S., upper Midwest), the growing season includes regular rain events. For row-crop applications where the weeding window is short (a few weeks after emergence), losing even 5 days to rain can cut operating utilization by 30%.
Build a rain-day budget into your operating season estimate: how many days in your target operating window historically receive rain above the machine's rated operating threshold? This data is available from NOAA's weather station network for most agricultural regions.
Dust and Particulate Load
Dry, mechanically tilled soils — particularly in the Central Valley, Arizona desert agriculture, and high-plains dryland farming — generate dust concentrations that can overwhelm sensor cleaning budgets. Vision sensors that can accumulate enough dust in one day to require cleaning between every pass add operator time that may not be in the model.
Ask the vendor: "What is your recommended cleaning interval for vision sensors in environments with high dust load?" If the answer is "daily," budget operator time accordingly. If the answer is "our sensors are self-cleaning," ask to see field data from a dusty environment.
Temperature Extremes
Battery-electric systems lose capacity in cold temperatures — a well-documented limitation of lithium chemistries. At 20°F, many EV-class batteries deliver 70–80% of rated capacity. At 0°F, some systems will not operate at all. For winter cover crop management, fall planting operations, or cold-climate greenhouse operations, verify the machine's minimum operating temperature.
At the high end, electronics cooling is the constraint. Most autonomous ag robots have operating temperature ceilings of 105–113°F (40–45°C). Desert agricultural regions regularly exceed this during summer operations. Know your peak operating temperature and confirm the machine is rated for it.
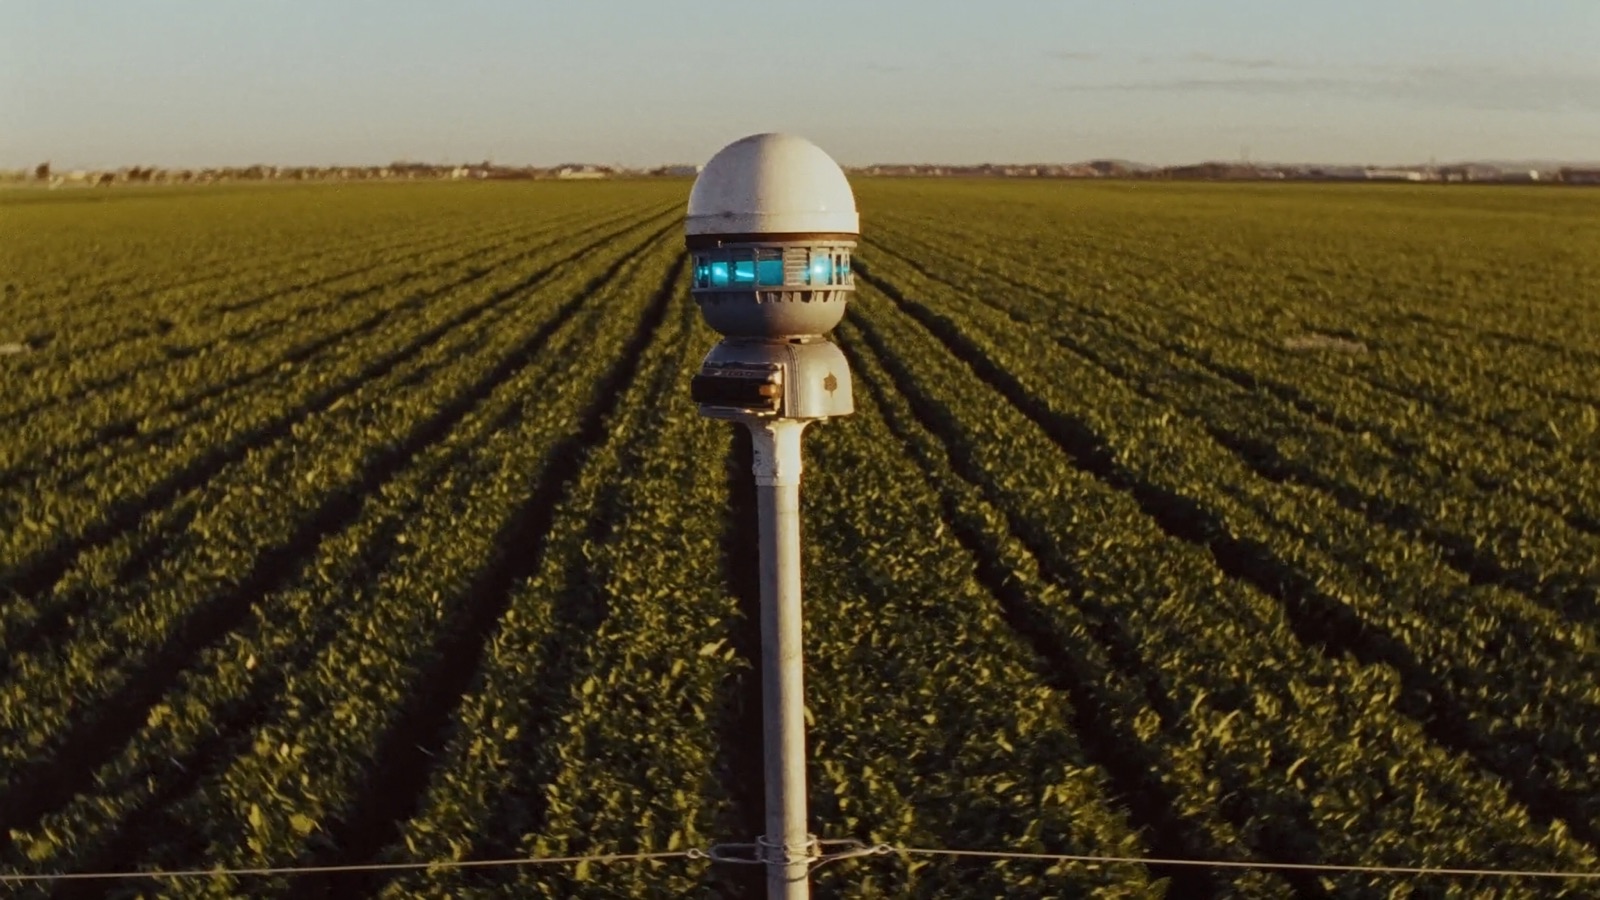
Crop Spacing: Row Width, In-Row Spacing, and Canopy Architecture
Row Width Compatibility
Every autonomous ag robot has a physical wheelbase that determines which row widths it can straddle without crop damage. Robots designed for wide-row crops (corn at 30 inches, cotton at 38 inches) cannot be redeployed in narrow-row crops (soybean at 15 inches, small grain at 7.5 inches) without modification — and modification may not be possible or may require new hardware.
Get the vendor's row width compatibility matrix in writing. Ask specifically:
- Minimum row width the machine can navigate without crop damage
- Maximum row width before the machine's sensors lose row-tracking accuracy
- Whether row width changes require hardware modification or just software reconfiguration
- How long that reconfiguration takes and what it costs
In-Row Plant Spacing and Geometry
For plant-level discrimination tasks (weed detection, harvest, thinning), in-row spacing determines how much time the machine has to process each decision point. At 4 mph with 6-inch in-row plant spacing, the machine sees a new plant approximately every 0.08 seconds. That's a hard real-time processing constraint.
If your crop is direct-seeded at variable spacing (as opposed to transplanted at fixed spacing), the machine's detection model needs to handle the variance in plant position without false positives. Ask the vendor for their false-positive rate at your specific crop's in-row spacing and typical stand variability. "Works on lettuce" is not sufficient — which lettuce variety, which bed configuration, which seeding rate.
Canopy Architecture
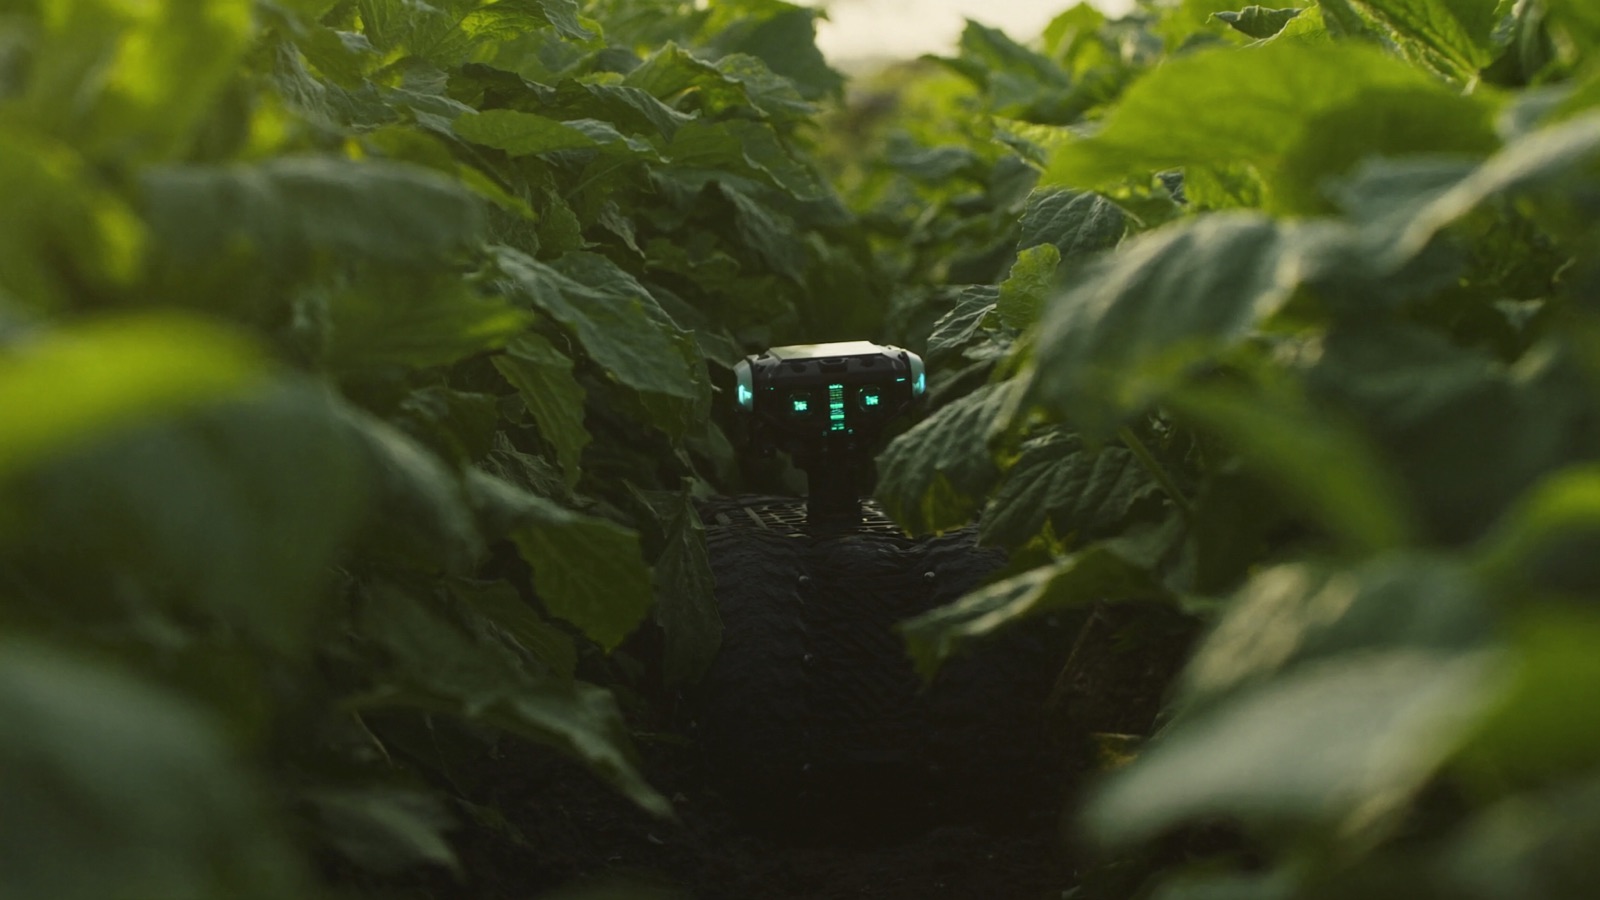
Low-growing, dense-canopy crops (strawberries, squash, melon) create an environment where ground-level vision is occluded before the crop reaches full size. Robots designed for upright crops (corn, celery, broccoli) may not physically fit between rows as canopy closes.
Taller-canopy crops that arch over the row center (mature berry canes, some dry bean varieties) can physically obstruct robot passage mid-season even when they were accessible at planting.
Map your canopy development across the season and identify any period where the planned robot geometry is no longer compatible with the physical crop structure. A robot that can run for 6 weeks and then gets locked out for 4 weeks as the canopy develops has a different utilization profile than one that operates the whole season.
Headland Geometry
Headland length — the distance at the end of each row where the machine turns around — is a deceptively important variable. Short headlands increase the turn-to-work-pass ratio, which:
- Increases cycle time per acre (reducing effective acres/hour)
- Creates more tight-radius maneuvers, which stress drivetrains and increase wear
- Can push the machine onto softer soil or obstacles at field edges
The minimum headland a robot requires for an unassisted turn depends on its physical turning radius. Wheeled autonomous robots typically require 10–20 feet of clear headland for a smooth 180-degree turn. On fields with short headlands — common in older orchard plantings and market gardens with permanent infrastructure at field edges — the robot may require manual repositioning at every row end, adding operator time that significantly degrades effective utilization.
Measure your actual headland lengths on the planned operating fields. Get the machine's minimum headland requirement from the vendor. If the headland gap is significant, either negotiate for assisted-turn support (operator repositions at row end) or price the additional operator time into your economics.
Pre-Deployment Site Assessment Checklist
Before signing a pilot agreement, collect this data on every planned operating field:
- Slope map from drone survey or USDA Web Soil Survey — identify any area exceeding machine rated maximum
- Historical trafficability window — number of days per year soil conditions permit traffic
- Fog / low-visibility day count during target operating season
- Rain-day budget during target operating window
- Dust load assessment — especially for vision-sensor-dependent systems
- Row width measured at multiple points (row width is not always consistent)
- In-row plant spacing range for target variety
- Canopy development timeline — when does canopy close, and does it restrict robot access?
- Headland length measured at both field ends
- Obstacle documentation — rocks, irrigation infrastructure, debris, drainage features
Any gap on this list is a risk item. If you don't know the number, you don't know whether the economics hold.
Next in this series: from research plot to commercial scale — a two-season playbook for ag robot adoption.