MiR100 vs OL Series
Side-by-side comparison of MiR100 (MiR) and OL Series (OMRON Robotics) — specs, pricing, Robo Score, and verified deployments. Updated daily.
Optimize comparison for buyer
Layer 1: Identity & Trust
Manufacturer Country
- MiR100Denmark
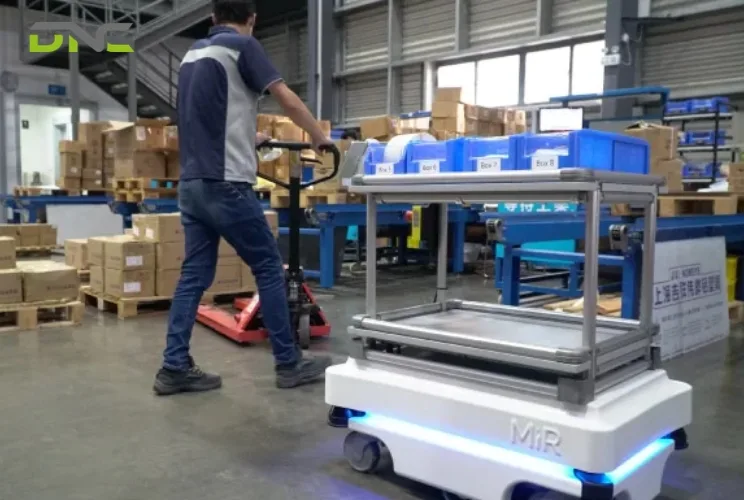
- OL SeriesJapan
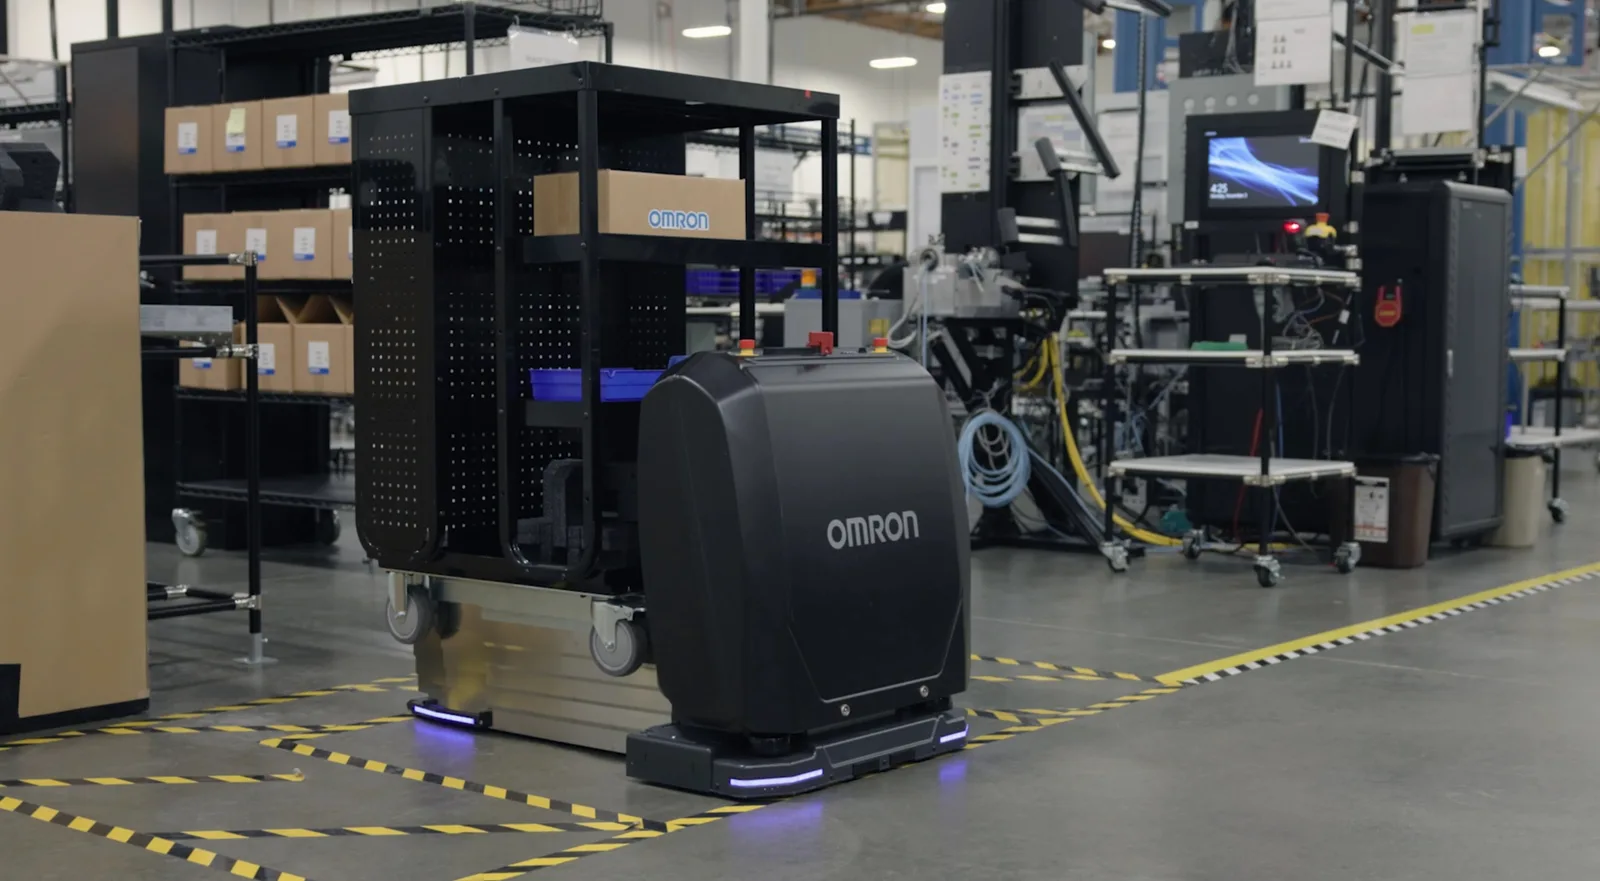
Year First Available
- MiR1002015
- OL Series2026
Verified Deployments
- MiR1000 Deployments
- OL Series0 Deployments
Layer 2: Operational
Battery / Shift Runtime
- MiR100—
- OL Series7 hrs
Availability Status
- MiR100ACTIVE
- OL SeriesACTIVE
Payload & Form Factor
Payload
- MiR100100 kg
- OL Series450 kg
AMR Subtype
- MiR100unit load carrier
- OL Seriesp2g cart
Robot Weight
- MiR100350 kg
- OL Series—
Navigation & Sensing
Navigation Type
- MiR100slam natural
- OL Seriesnatural feature
Pedestrian Detection
- MiR100—
- OL SeriesYes
Battery
Battery Chemistry
- MiR100li ion
- OL Series—
Runtime (Loaded)
- MiR100—
- OL Series7 hrs
Charging Time
- MiR100—
- OL Series0.4 hrs
Auto Docking
- MiR100—
- OL SeriesYes
Safety
ISO 3691-4 Certified
- MiR100—
- OL SeriesNo
Emergency Stops
- MiR100—
- OL Series2
Safety LiDAR Coverage
- MiR100—
- OL Series360 °
Safety Zone Count
- MiR100—
- OL Series29
Connectivity
API Type
- MiR100—
- OL Seriesopen rest
Multi-Robot Traffic Mgmt
- MiR100—
- OL SeriesYes
| ||
|---|---|---|
| Layer 1: Identity & Trust | ||
| Manufacturer Country (values differ) | Denmark | Japan |
| Year First Available (values differ) | 2015 | 2026 |
| Verified Deployments | 0 Deployments | 0 Deployments |
| Layer 2: Operational | ||
| Battery / Shift Runtime (values differ) | — | 7 hrs |
| Availability Status | ACTIVE | ACTIVE |
| Layer 3: Category Specific | ||
| Payload & Form Factor | ||
| Payload (values differ) | 100 kg | 450 kg |
| AMR Subtype (values differ) | unit load carrier | p2g cart |
| Robot Weight (values differ) | 350 kg | — |
| Navigation & Sensing | ||
| Navigation Type (values differ) | slam natural | natural feature |
| Pedestrian Detection (values differ) | — | Yes |
| Battery | ||
| Battery Chemistry (values differ) | li ion | — |
| Runtime (Loaded) (values differ) | — | 7 hrs |
| Charging Time (values differ) | — | 0.4 hrs |
| Auto Docking (values differ) | — | Yes |
| Safety | ||
| ISO 3691-4 Certified (values differ) | — | No |
| Emergency Stops (values differ) | — | 2 |
| Safety LiDAR Coverage (values differ) | — | 360 ° |
| Safety Zone Count (values differ) | — | 29 |
| Connectivity | ||
| API Type (values differ) | — | open rest |
| Multi-Robot Traffic Mgmt (values differ) | — | Yes |
Insufficient data for full comparison
The following fields had no data for any of the selected robots: Price, Length, Width, Turning Radius, Min Aisle Width, Ground Clearance, Localization Accuracy, Docking Repeatability, Obstacle Detection Range, Min Object Detection Height, Max Speed (Loaded), Max Speed (Unloaded), Picks / Hour / Robot, Battery Capacity, Opportunity Charging, Battery Swap, Charge Cycles (Rated), R15.08 Certified, Safety Category, Audible Alert, WMS Integrations, Fleet Size Supported, OTA Updates, Cybersecurity Certs, MTBF, Uptime SLA, Predictive Maintenance, Field Service Response, Spare Parts Lead Time, Price (USD), RaaS / Month, Pricing Models, Warranty, Expected Service Life
ROI Comparison
Same operating assumptions across every robot — the only difference is price. Set your numbers once to see which pays back fastest.
Annual labor displaced (per robot): $50,000
| Metric | MiR100 | OL Series |
|---|---|---|
| Investment | No price | No price |
| Payback period | — | — |
| Net savings (5 yr) | — | — |
| ROI (5 yr) | — | — |
MiR100, OL Series have no listed price, so payback can't be computed. Contact the manufacturer for a quote.
Estimates labor-cost displacement only — not a full total cost of ownership. Actual ROI depends on integration, maintenance, training, downtime, and task fit. Converted currencies are indicative; USD is the price of record.
Trade-offs at a glance
Frequently asked
Who makes MiR100 and OL Series?
MiR100 is made by MiR, based in DK. OL Series is made by OMRON Robotics, based in JP.
When were MiR100 and OL Series launched?
MiR100 launched in 2015. OL Series launched in 2026.
How do MiR100 and OL Series compare on the Robo Score?
MiR100 scores 73.1 on the Robo Score. OL Series scores 54.2. The Robo Score is a 0–100 credibility figure blending commercial maturity, verified deployments, company standing, and independent coverage — see methodology for the full breakdown.
Are MiR100 and OL Series in the same category?
Both robots are classified as Amr Warehouse on Robolist. Filters and ranking treat them as direct alternatives.
What is the realistic total cost of ownership for Amr Warehouse robots?
Hardware cost is one input. Amr Warehouse TCO also includes integration, training, downtime, and end-of-life. Our breakdown: AMR TCO: Fleet Size, Charging Infrastructure, and WMS Integration.
What should a buyer ask vendors when choosing between MiR100 and OL Series?
Spec sheets only show part of the story. Useful vendor questions cover support, lifecycle, integration cost, and references. We have a buyer-focused checklist: AMR Vendor Selection: Orchestration, Integration, and Scaling.
Going deeper — picking the right robot
AMR TCO: Fleet Size, Charging Infrastructure, and WMS Integration
8 min readWarehouse AMRs
AMR Vendor Selection: Orchestration, Integration, and Scaling
9 min readWarehouse AMRs
AMR Pilot in an Existing Warehouse: The 90-Day Playbook
9 min readWarehouse AMRs
Build vs buy vs lease: which model fits a first deployment
8 min readChoosing Your First Robot
The hidden specs vendors hope you'll miss
10 min readReading the Spec Sheet
Want to be notified when specs or pricing change for these robots? Drop your email.
Other comparisons
About this comparison
MiR100 vs OL Series compares two robots in the amr-warehouse category. All data is sourced from manufacturer spec sheets, verified deployments, and third-party filings; see our methodology for how the Robo Score is calculated.