Core vs Nextage
Side-by-side comparison of Core (Standard Bots) and Nextage (Kawada Industries) — specs, pricing, Robo Index, and verified deployments. Updated daily.
Optimize comparison for buyer
Optimized for Manufacturing buyers. Priority specs lifted to the top and marked with a target.
Layer 1: Identity & Trust
Manufacturer Country
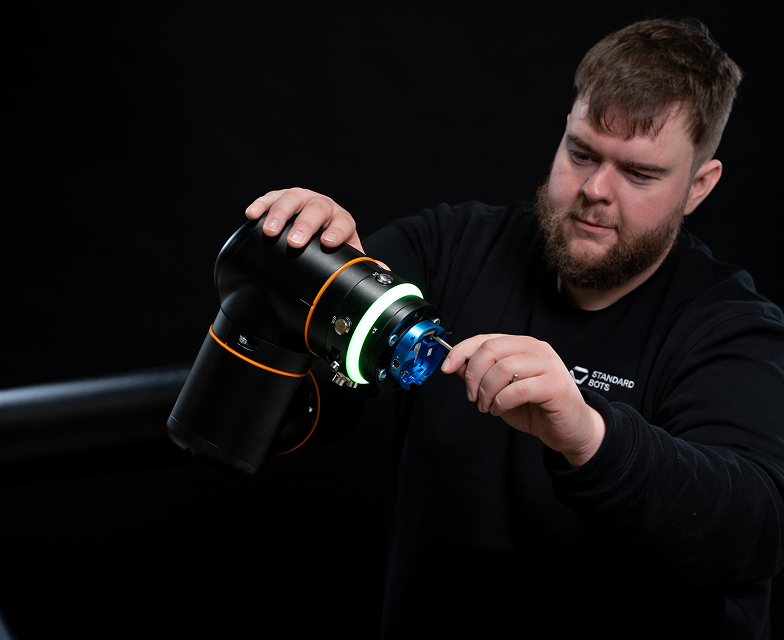
- CoreUnited States
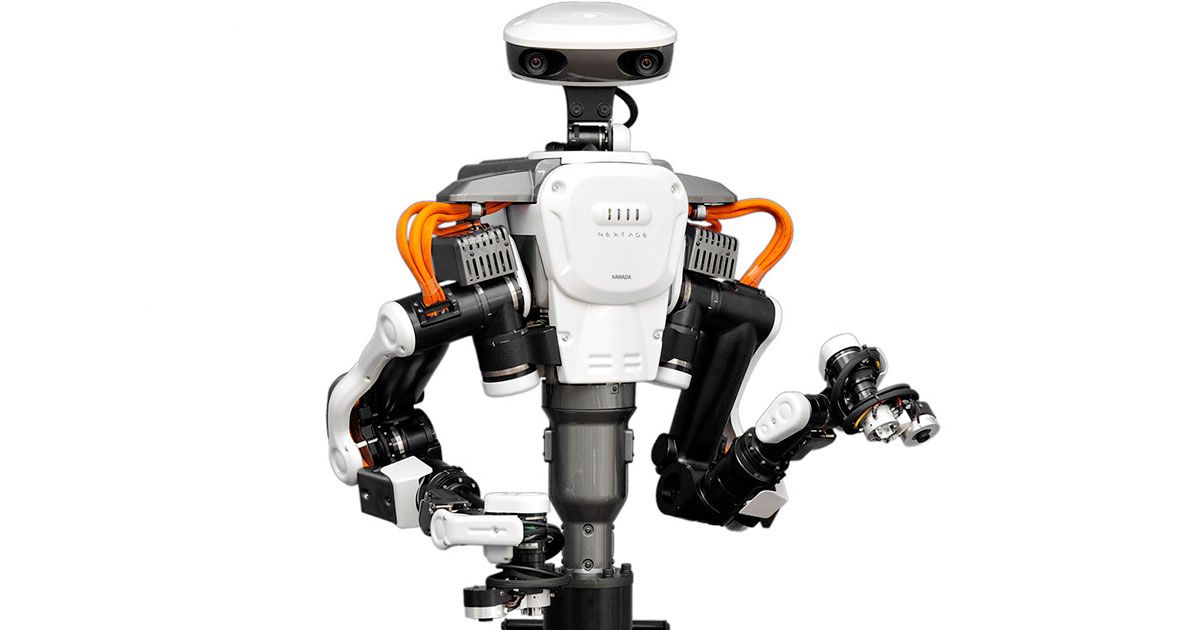
- NextageJapan
Year First Available
- Core—
- Nextage2009
Verified Deployments
- Core0 Deployments
- Nextage0 Deployments
Layer 2: Operational
Price Range (USD)
- Core$37,000–$42,000 USD
- NextageContact for quote
Availability Status
- CoreACTIVE
- NextageACTIVE
Arm Mechanics
Reach
- Core1,300 mm
- Nextage1,450 mm
Repeatability
- Core±0.025 mm
- Nextage±0.03 mm
Payload
- Core18 kg
- Nextage1.5 kg
Degrees of Freedom
- Core6
- Nextage15
Max TCP Speed
- Core3 m/s
- Nextage—
Robot Weight
- Core32 kg
- Nextage28 kg
Mounting Options
- Corefloor, mobile
- Nextagefloor
Safety
Safety Rating
- Corenot stated
- NextageISO10218
Force/Torque Sensing
- Corenone
- Nextagenone
Ease of Use
No-Code Capable
- CoreYes
- Nextage—
Offline Programming
- CoreNo
- Nextage—
Programming Interface
- Coreno-code visual programming
- Nextagecode_ros
Software & Connectivity
ROS Compatible
- CoreNo
- NextageYes
Commercial
Price (USD)
- Core$37,000–$42,000 USD
- NextageContact for quote
Lead Time
- Core4 wks
- Nextage—
| | |
|---|---|---|
| Layer 1: Identity & Trust | ||
| Manufacturer Country (values differ) | United States | Japan |
| Year First Available (values differ) | — | 2009 |
| Verified Deployments | 0 Deployments | 0 Deployments |
| Layer 2: Operational | ||
| Price Range (USD) (values differ) | $37,000–$42,000 USD | Contact for quote |
| Availability Status | ACTIVE | ACTIVE |
| Layer 3: Category Specific | ||
| Arm Mechanics | ||
| Reach (priority for Manufacturing buyers) (values differ) | 1,300 mm | 1,450 mm |
| Repeatability (priority for Manufacturing buyers) (values differ) | ±0.025 mm | ±0.03 mm |
| Payload (priority for Manufacturing buyers) (values differ) | 18 kg | 1.5 kg |
| Degrees of Freedom (values differ) | 6 | 15 |
| Max TCP Speed (values differ) | 3 m/s | — |
| Robot Weight (values differ) | 32 kg | 28 kg |
| Mounting Options (values differ) | floor, mobile | floor |
| Safety | ||
| Safety Rating (values differ) | not stated | ISO10218 |
| Force/Torque Sensing | none | none |
| Ease of Use | ||
| No-Code Capable (values differ) | Yes | — |
| Offline Programming (values differ) | No | — |
| Programming Interface (values differ) | no-code visual programming | code_ros |
| Software & Connectivity | ||
| ROS Compatible (values differ) | No | Yes |
| Commercial | ||
| Price (USD) (values differ) | $37,000–$42,000 USD | Contact for quote |
| Lead Time (values differ) | 4 wks | — |
Insufficient data for full comparison
The following fields had no data for any of the selected robots: Battery / Shift Runtime, IP Rating, TCP Speed (Collaborative), Power/Force Limiting, Safety I/O Pairs, Duty Cycle, Setup Time, Time to Redeploy, Tool Flange Standard, Tool Changer Support, Integrated F/T Sensor, Wrist Power Supply, SDK Languages, Fieldbus Protocols, Digital Twin Support, MTBF, Path Accuracy, CaaS / Month, Warranty
best in categoryweakest in categoryvalues differ
Trade-offs at a glance
Frequently asked
Who makes Core and Nextage?
Core is made by Standard Bots, based in US. Nextage is made by Kawada Industries, based in JP.
How do Core and Nextage compare on the Robo Index?
Core grades A on the Robo Index. Nextage grades AA. The Robo Index is a credibility grade (AAA … C) that blends commercial maturity, verified deployments, company standing, and independent coverage — see methodology for the full breakdown.
How does the reach of Core compare to Nextage?
Core has a reach of 1300 mm. Nextage has a reach of 1450 mm.
Are Core and Nextage in the same category?
Both robots are classified as Cobot on Robolist. Filters and ranking treat them as direct alternatives.
What is the realistic total cost of ownership for Cobot robots?
Hardware cost is one input. Cobot TCO also includes integration, training, downtime, and end-of-life. Our breakdown: Cobot TCO and Payback Math: Hardware, EOAT, and Zero-Fencing Savings.
What should a buyer ask vendors when choosing between Core and Nextage?
Spec sheets only show part of the story. Useful vendor questions cover support, lifecycle, integration cost, and references. We have a buyer-focused checklist: Cobot Vendor Red Flags: Questions That Filter Out the Marketing.
Going deeper — picking the right robot
Cobot TCO and Payback Math: Hardware, EOAT, and Zero-Fencing Savings
6 min readCollaborative Robots
Cobot Vendor Red Flags: Questions That Filter Out the Marketing
9 min readCollaborative Robots
Running a Cobot Pilot in a Manual Production Line
9 min readCollaborative Robots
Build vs buy vs lease: which model fits a first deployment
8 min readChoosing Your First Robot
The hidden specs vendors hope you'll miss
10 min readReading the Spec Sheet
Want to be notified when specs or pricing change for these robots? Drop your email.
About this comparison
Core vs Nextage compares two robots in the cobot category. All data is sourced from manufacturer spec sheets, verified deployments, and third-party filings; see our methodology for how the Robo Index is calculated.