Darwin-OP vs Figure 03
Side-by-side comparison of Darwin-OP (ROBOTIS Co., Ltd.) and Figure 03 (Figure AI) — specs, pricing, Robo Index, and verified deployments. Updated daily.
Optimize comparison for buyer
Optimized for Hospitality & F&B buyers. Priority specs lifted to the top and marked with a target.
Layer 1: Identity & Trust
Manufacturer Country
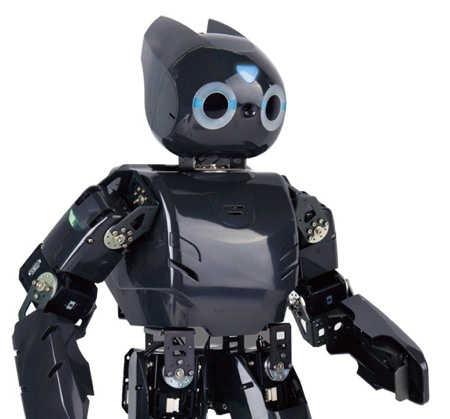
- Darwin-OPSouth Korea
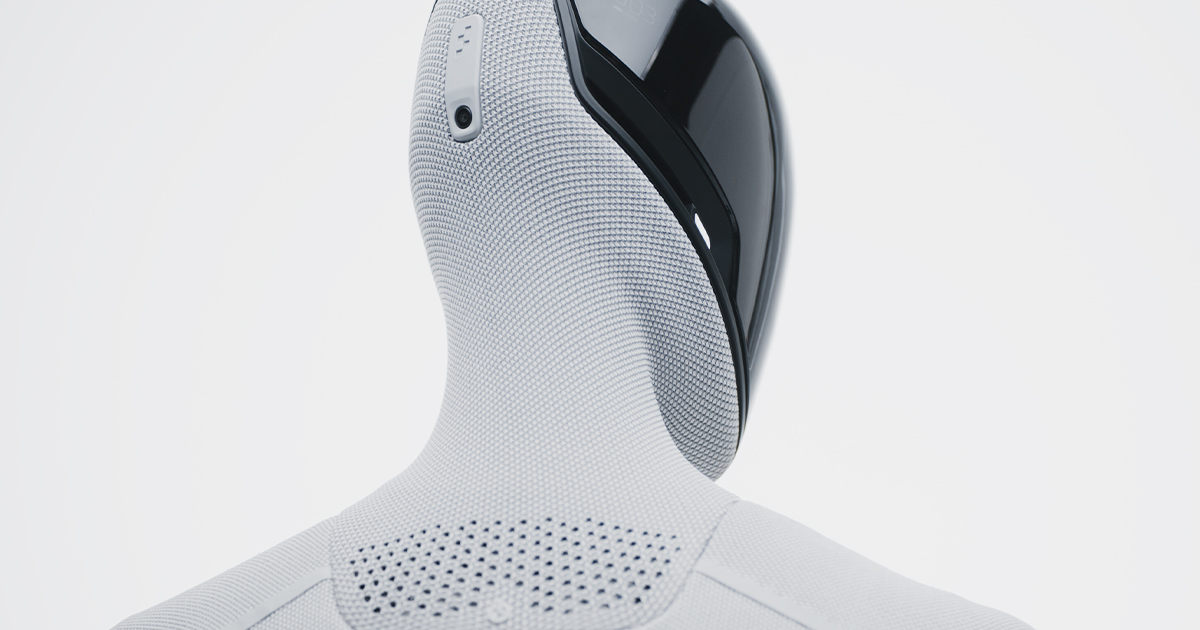
- Figure 03United States
Year First Available
- Darwin-OP2010
- Figure 032025
Verified Deployments
- Darwin-OP0 Deployments
- Figure 030 Deployments
Layer 2: Operational
Price
- Darwin-OP$12,000 USD
- Figure 03$130,000 USD
Battery / Shift Runtime
- Darwin-OP0.5 hrs
- Figure 035 hrs
Availability Status
- Darwin-OPACTIVE
- Figure 03ACTIVE
Physical Form Factor
Weight
- Darwin-OP9.1 kg
- Figure 0361 kg
Height
- Darwin-OP45.72 cm
- Figure 031730 mm
Mobility Type
- Darwin-OPbipedal
- Figure 03—
Humanoid Subtype
- Darwin-OPfull bipedal
- Figure 03—
Walking Speed
- Darwin-OP0.2 m/s
- Figure 031.2 m/s
Stair Climbing
- Darwin-OPNo
- Figure 03—
Terrain
- Darwin-OPflat indoor
- Figure 03both
Payload & Dexterity
Payload
- Darwin-OP—
- Figure 0320 kg
Total DOF
- Darwin-OP20
- Figure 0348
Arm DOF
- Darwin-OP3
- Figure 0324
Hand DOF
- Darwin-OP—
- Figure 0324
Bimanual Coordination
- Darwin-OPNo
- Figure 03—
Compute & AI
Onboard Compute
- Darwin-OPIntel Atom N2600 @1.6 GHz dual core
- Figure 03—
VLM Capable
- Darwin-OPNo
- Figure 03—
Foundation Models
- Darwin-OPfalse
- Figure 03—
Imitation Learning
- Darwin-OPNo
- Figure 03—
Programming
- Darwin-OPcode_python, code_ros
- Figure 03—
Battery & Power
Runtime
- Darwin-OP0.5 hrs
- Figure 035 hrs
Battery Swap
- Darwin-OPNo
- Figure 03—
Software
SDK Languages
- Darwin-OPC++
- Figure 03—
ROS Support
- Darwin-OPYes
- Figure 03—
Open API
- Darwin-OPYes
- Figure 03—
Reliability
Deployment Maturity
- Darwin-OPcommercial
- Figure 03—
Commercial
Price (USD)
- Darwin-OP$12,000 USD
- Figure 03$130,000 USD
Price Tier
- Darwin-OP10-20K
- Figure 0320-40K
Pricing Model
- Darwin-OPpurchase
- Figure 03purchase
Warranty
- Darwin-OP1 yrs
- Figure 03—
Applications
- Darwin-OPeducation, research
- Figure 03manufacturing, logistics, quality inspection
| ||
|---|---|---|
| Layer 1: Identity & Trust | ||
| Manufacturer Country (values differ) | South Korea | United States |
| Year First Available (values differ) | 2010 | 2025 |
| Verified Deployments | 0 Deployments | 0 Deployments |
| Layer 2: Operational | ||
| Price (values differ) | $12,000 USD | $130,000 USD |
| Battery / Shift Runtime (priority for Hospitality & F&B buyers) (values differ) | 0.5 hrs | 5 hrs |
| Availability Status | ACTIVE | ACTIVE |
| Layer 3: Category Specific | ||
| Physical Form Factor | ||
| Weight (priority for Hospitality & F&B buyers) (values differ) | 9.1 kg | 61 kg |
| Height (values differ) | 45.72 cm | 1730 mm |
| Mobility Type (values differ) | bipedal | — |
| Humanoid Subtype (values differ) | full bipedal | — |
| Walking Speed (values differ) | 0.2 m/s | 1.2 m/s |
| Stair Climbing (values differ) | No | — |
| Terrain (values differ) | flat indoor | both |
| Payload & Dexterity | ||
| Payload (values differ) | — | 20 kg |
| Total DOF (values differ) | 20 | 48 |
| Arm DOF (values differ) | 3 | 24 |
| Hand DOF (values differ) | — | 24 |
| Bimanual Coordination (values differ) | No | — |
| Compute & AI | ||
| Onboard Compute (values differ) | Intel Atom N2600 @1.6 GHz dual core | — |
| VLM Capable (values differ) | No | — |
| Foundation Models (values differ) | false | — |
| Imitation Learning (values differ) | No | — |
| Programming (values differ) | code_python, code_ros | — |
| Battery & Power | ||
| Runtime (values differ) | 0.5 hrs | 5 hrs |
| Battery Swap (values differ) | No | — |
| Software | ||
| SDK Languages (values differ) | C++ | — |
| ROS Support (values differ) | Yes | — |
| Open API (values differ) | Yes | — |
| Reliability | ||
| Deployment Maturity (values differ) | commercial | — |
| Commercial | ||
| Price (USD) (values differ) | $12,000 USD | $130,000 USD |
| Price Tier (values differ) | 10-20K | 20-40K |
| Pricing Model | purchase | purchase |
| Warranty (values differ) | 1 yrs | — |
| Applications (values differ) | education, research | manufacturing, logistics, quality inspection |
Insufficient data for full comparison
The following fields had no data for any of the selected robots: Running Capable, Payload (Peak), Arm Reach, Grip Strength, Manipulation Repeatability, Tool Use, Compute Platform, Teleoperation, Battery Capacity, Charging Time, Charging Method, Avg Power Consumption, Force-Limited Arms, Fall Recovery, Fall Detection Response, Emergency Stops, Human Detection Method, Safe Speed Near Humans, Simulation Platforms, Air-Gap Capable, MTBF, Task Success Rate, IP Rating, Noise Level, RaaS / Month, Developer Unit Price, Delivery Lead Time, Production Pilots
ROI Comparison
Same operating assumptions across every robot — the only difference is price. Set your numbers once to see which pays back fastest.
Annual labor displaced (per robot): $50,000
| Metric | Darwin-OP | Figure 03 |
|---|---|---|
| Investment | $12,000 | $130,000 |
| Payback period | 2.9 mo | 31.2 mo |
| Net savings (5 yr) | $238,000 | $120,000 |
| ROI (5 yr) | +1983% | +92% |
Estimates labor-cost displacement only — not a full total cost of ownership. Actual ROI depends on integration, maintenance, training, downtime, and task fit. Converted currencies are indicative; USD is the price of record.
Trade-offs at a glance
Frequently asked
Who makes Darwin-OP and Figure 03?
Darwin-OP is made by ROBOTIS Co., Ltd., based in KR. Figure 03 is made by Figure AI, based in US.
When were Darwin-OP and Figure 03 launched?
Darwin-OP launched in 2010. Figure 03 launched in 2025.
How much does Darwin-OP cost compared to Figure 03?
Darwin-OP is listed at $12,000. Figure 03 is listed at $130,000.
How do Darwin-OP and Figure 03 compare on the Robo Index?
Darwin-OP grades AA on the Robo Index. Figure 03 grades A. The Robo Index is a credibility grade (AAA … C) that blends commercial maturity, verified deployments, company standing, and independent coverage — see methodology for the full breakdown.
Are Darwin-OP and Figure 03 in the same category?
Both robots are classified as Humanoid on Robolist. Filters and ranking treat them as direct alternatives.
What is the realistic total cost of ownership for Humanoid robots?
Hardware cost is one input. Humanoid TCO also includes integration, training, downtime, and end-of-life. Our breakdown: Humanoid TCO: Hardware, Cloud Subscriptions, and the Cost of Teleop Time.
What should a buyer ask vendors when choosing between Darwin-OP and Figure 03?
Spec sheets only show part of the story. Useful vendor questions cover support, lifecycle, integration cost, and references. We have a buyer-focused checklist: Vendor Selection for Humanoids: The 10 Questions You Must Ask.
Going deeper — picking the right robot
Humanoid TCO: Hardware, Cloud Subscriptions, and the Cost of Teleop Time
8 min readHumanoid Robots
Vendor Selection for Humanoids: The 10 Questions You Must Ask
10 min readHumanoid Robots
Running a Humanoid Pilot: Scope, Success Criteria, and Exit Options
9 min readHumanoid Robots
Build vs buy vs lease: which model fits a first deployment
8 min readChoosing Your First Robot
The hidden specs vendors hope you'll miss
10 min readReading the Spec Sheet
Want to be notified when specs or pricing change for these robots? Drop your email.
Other comparisons
About this comparison
Darwin-OP vs Figure 03 compares two robots in the humanoid category. All data is sourced from manufacturer spec sheets, verified deployments, and third-party filings; see our methodology for how the Robo Index is calculated.